Debugging
Having studied your way through this user's guide, you are now - undoubtedly - a show control programming expert. Even experts make mistakes though, so WinScript Live offers several debugging tools to find issues and undesired behaviors in your scripts.
Quote
Debugging is twice as hard as writing the code in the first place. Therefore, if you write the code as cleverly as possible, you are, by definition, not smart enough to debug it.
-- Brian Kernighan
Error Checker
The error checker is going to be the first line of defense against typos and invalid events. The error checker runs before you send a script to a device, or when you choose the "Save and Error Check" option from the file menu. The results of the error checker are shown in the "Errors" window, which you can open from the toolbar by choosing View->Errors.
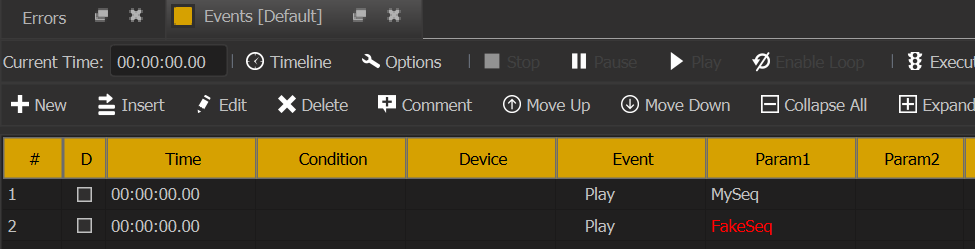
Let's look at an example. In this screenshot, there's a sequence with two Play events. One for a sequence that exists, and one for a sequence that doesn't. WinScript Live recognizes that an invalid parameter was entered (the non-existent sequence), and makes the sequence name red.
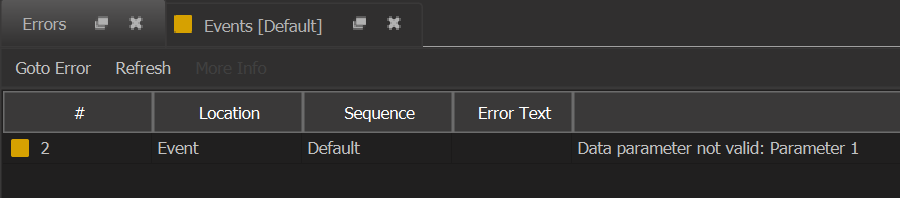
If you open the Errors window, you'll also see the error listed there, where it describes the location of the error and a description of the error. Clicking the error will take you to the sequence where it is located.
WinScript Live does let you transfer scripts with errors to a device, allowing you to leave place holders for future sequences or devices during script development. It is best practice to clear all errors before final deployment of a script to an attraction.
Watch Lists
Watch Lists are a list of WinScript Live resources that you can monitor while connected in Live Mode to your device. The current value of the resource is displayed, and you can enable a "forced" value for that resource, overriding the current value with the one you specify in the Watch List.
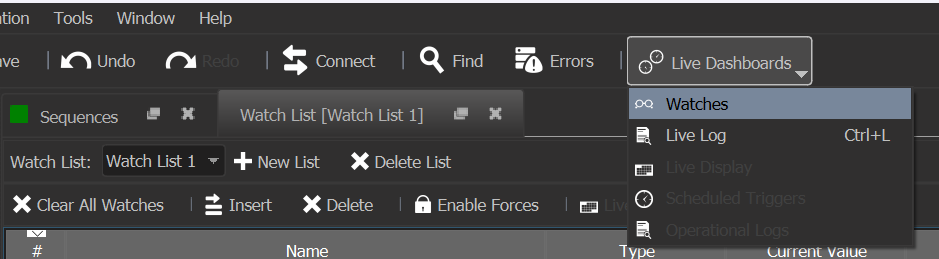
To access your watch lists, click "Watches" in the "Live Dashboards" dropdown on the toolbar.
From this window, you can add new Watch Lists or add additional resources. By default, all new Scripts start with two empty watch lists - "Script" and "Watch List 1".
To add a resource to the watch list, type its name or choose it from the dropdown in the "Name" column. When you are in Live Mode, the "Current" value column will show the current value of that resource.
Note
Not all resources will show a "Current Value" in the watch list or allow forces - devices, for example. However, it can still be useful to add them to your watch list to monitor their state in the Live Log, which we'll explore in the next section.
Removing a resource from a watch list causes WinScript to stop monitoring the resource, but does not remove the resource from your script or change it's state (unless it was being forced).
To force the resource to a value, enter the desired value in the "Force Value" column and click the "Enable Force" checkbox. You must be in Live Mode to force a value. When you uncheck the "Enable Force" checkbox, the value will return to it's normal value as determined by the state of the script.
The "Enable Forces" button in the Watch List toolbar will select the "Enable Force" checkbox for all resources in that watch list.
The watch list allows the programmer to get a live and up to date look at the internal state of the script. The use-cases are endless, but let's consider a simple example:
You have an attraction with four vehicles, and you are tracking their position by writing their current scene number into a variable, like "Vehicle1Scene". You could add your four vehicle variables into the Watch List, connect in Live Mode, and get an up to date look at the value of those variables as the attraction runs and the vehicles move through your scenes.
But sometimes you don't just want the current state of your resources, you need a log of their changes over time. For that, use your Watch List's best buddy - the Live Log!
Live Log
The Live Log is a log of all the resource changes that have occurred while the Live Log has been open and WinScript Live has been connected to the controller in Live Mode. You can open the Live Log by choosing "Live Log" from the same "Live Dashboards" dropdown where you found the Watch List.
The Live Log shows changes to resources that are in a Watch List. By default, the Live Log is pointed at the "Watch List 1" watch list, but you can choose any list from the Drop Down menu at the top of the Live Log.
In addition to the resources in your watch list, all Live Logs will show the following:
- Sequence state changes, when the "Log All Sequence Changes" button in pressed in the Live Log window.
- Events that executed but resulted in an error, when the "Log Event Errors" button is pressed in the Live Log window.
- Sequence starts due to a Scheduled Sequence Trigger executing.
- User log messages generated by the 'Log Message' event being used in a sequence.
- Incoming messages to the device running the script
Tip
One of the most valuable uses of the Live Log is to monitor device communication. If you add a Device resource to your watch list and look in the Live Log, you'll see all communication to and from that device.
Depending on how many resources you have in your Watch List, the number of entries appearing in the Live Log can be overwhelming. Clicking the "Pause" button will pause new entries from appearing in the Live Log. The "Save to File" or "Copy to Clipboard" buttons allow you to sift through your log at a later time in the text editor of your choice.
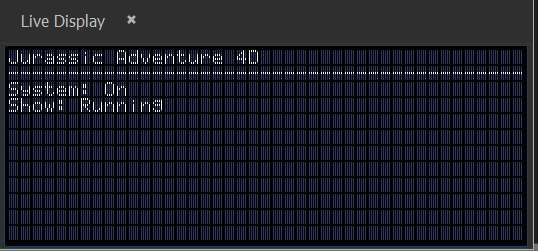
Live Display
Many Alcorn McBride devices have front panel displays that can be used to display script and show status. If you are programming without physical access to your device, you can use the "Live Display" window to get a preview of what is showing on the Front Panel Display at any given time.
The Live Display can be found in the "Live Dashboards" dropdown, under "Live Display".
Operational Logs
Operational Logs are persistent logs stored on internal storage of the device running your Script. You can write messages to the operational log, if enabled, using the "Log Message" event.
The Operational Logs feature is not available on the following devices:
- V16Pro
- VCore
- RidePlayer
Stored operational logs can be viewed and retrieved from a device while connected in Live Mode from the "Operational Logs" window, found under "Live Dashboards". They are also accessible from the FTP interface, in the "Logs" folder.
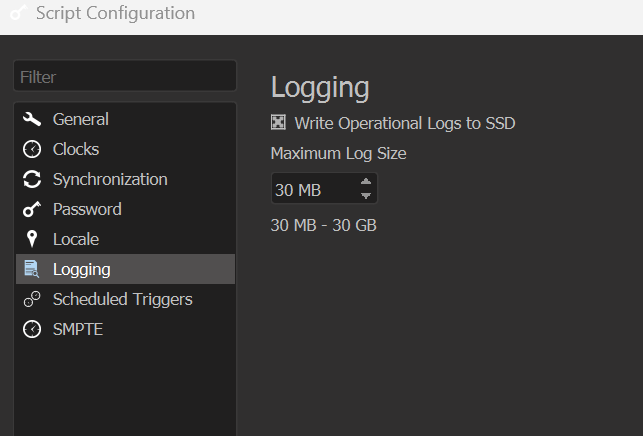
Operational Logs must be enabled in the 'Logging' section of the Script Configuration. Logs are stored in files that can grow up to 10MB in size. Once the 10MB size limit is reached, a new log file is created (and the previous log remains). If the combined size of the log files exceeds the maximum log size in the Script Configuration, the oldest log will be deleted to make room for new logs.
You may wish to store only certain log messages at different times. For example, you may want to limit log storage during normal operation to only "Warning" or "Error" levels, or store one or more "Custom" levels while troubleshooting an issue. You can do this by checking the appropriate boxes in the logging settings for the log levels that you want to have stored. In the image below, the logging module has been configured to store every log level to the internal storage.
Note
Unchecking a box here will only prevent the log message from being stored internally on the device. All log messages will still appear in the Live Log.